

On August 04, 2018, we created a survey to identify how mobile are medical laboratory scientist (MLS) and medical laboratory technician (MLT) during their careers. The variable of “Employers” was used and not jobs, since an MLS/MLT could have different jobs while employed at the same organization. There are many reasons why a person changes employers, however, this survey was meant to be a quick sampling of the MLS/MLT community. In order to obtain a large number of responses, the survey was shared on LinkedIn and Facebook, and in MLS/MLT-specific groups within those sites. The survey was composed of 2-questions and had an average completion time of approximately 33 seconds. It asked the following required questions:
- How long have you been an MLS/MLT?
- How many different employers have you worked for?
Respondents were asked to identify how many years of experience as an MLS/MLT and how many different employers they have worked for during that time. The purpose of obtaining responses to these questions was to identify how many employers have MLSs/MLTs worked for during their careers with set intervals as answers to Question #1: 0-5 Years, 5-10 Years, 10-15 Years, 15-20 Years, 20-25 Years, 25-30 Years, and 30+ Years.
For statistical purposes, it was assumed that the MLS/MLT population is 350,000. With a respondent rate of 256 individuals with a confidence level of 95%, the margin of error is 6%. With a higher margin of error, and thus a smaller sample size, the results obtained from this survey can only be used as a snapshot to possibly suggest a larger survey may be warranted at a later date.
Survey Results
With 256 responses, the results obtained are very interesting, however, the size of the sample can not be definitely stated as representative of the MLS/MLT population. With a suspension of disbelief by assuming that the results are representative of the MLS/MLT population, the results can be illuminating.
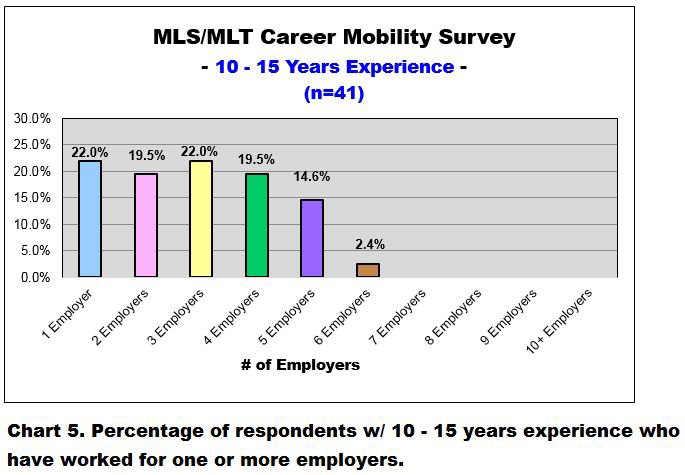
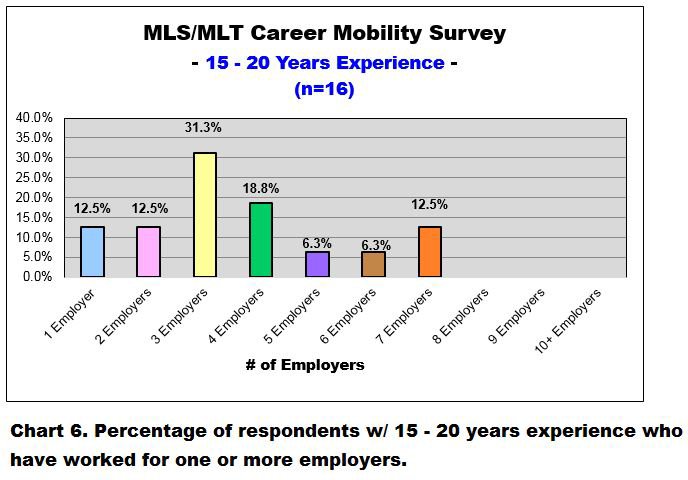
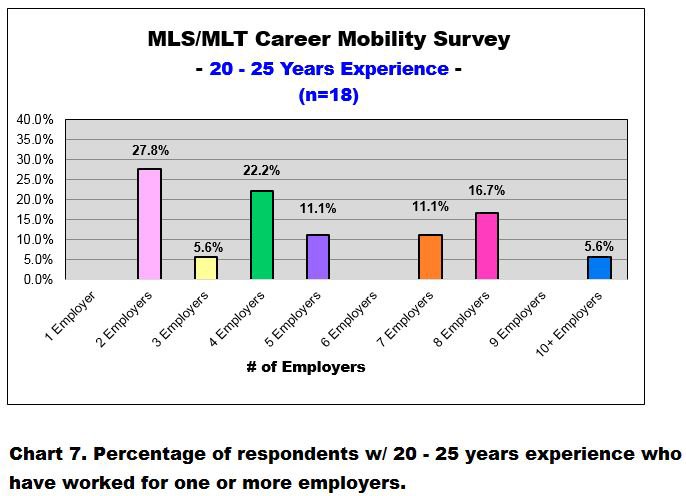
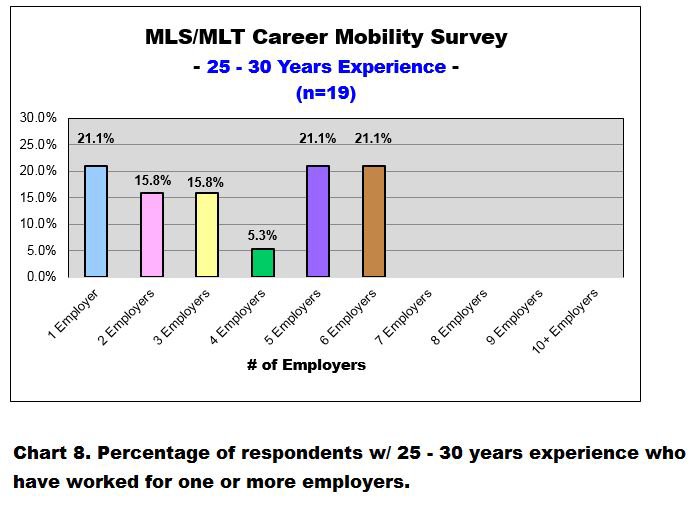
Chart 1 shows the majority of respondents are MLSs/MLTs that have 0 – 5 Years of experience (24.6%) and 30 + Years of experience (26.2%). If these results are an accurate representation of the MLS/MLT population, then the looming shortage of techs coming into the field will be exacerbated when the techs with 30+ years of experience retire. Also, the U.S. Department of Labor projects that there will be a need for 13% growth in employment of MLS/MLT to meet the need of an aging population over the next 10 years. That would be a huge loss of experience that will be filled by the mid-level techs (10 – 15 Years, 15 – 20 Years, 20 – 25 Years, 25 – 30 Years). Without a significant influx of medical laboratory professionals, this could potentially increase the movement among employers by all experience levels of MLSs/MLTs.
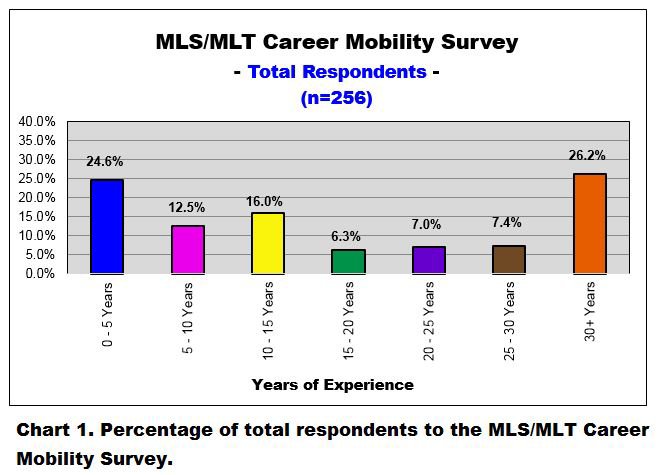
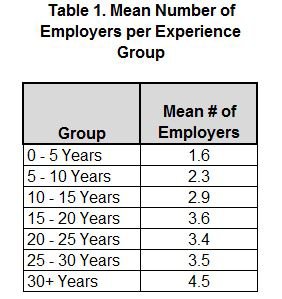
Chart 2 and Table 1 show that the majority of MLSs/MLTs will work for more than one employer. The American Society for Clinical Pathology (ASCP) Wage Survey of Medical Laboratories (2017) states that MLTs respondents (n=2483) have an average of 12.14 years of total experience and MLSs (n=8601) have an average of 15.96 years of total experience. To compare the average number of years of experience for both groups in the ASCP survey to the average number of years of experience in this survey, the average for both ASCP groups were calculated as 15.10 years. For the 256 respondents for this survey, it was calculated that the respondents have an average of 16.77 years of experience. Using Table 1, the average number of employers for the ASCP groups and the respondents to this survey are approximately 3.6 employers.

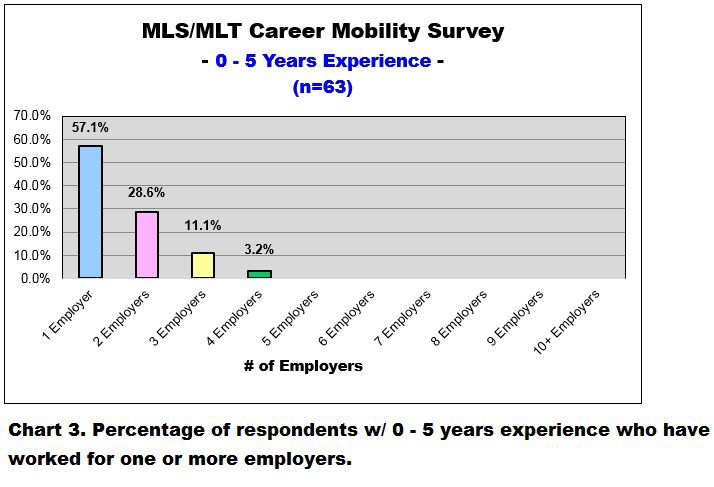
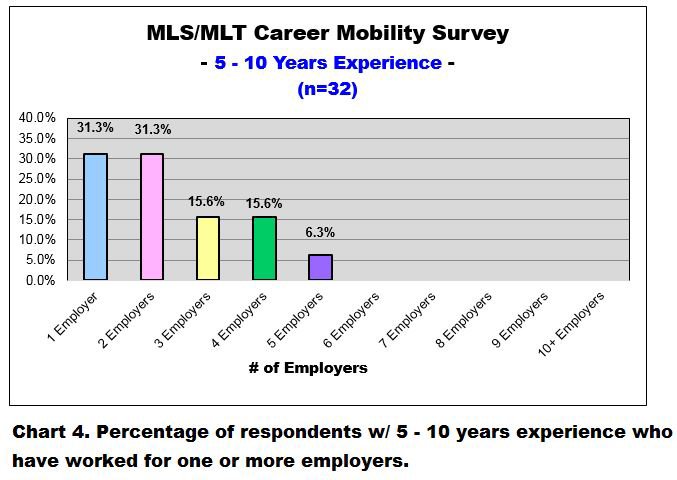
One of the surprising results that was obtained was the comparison between the proportion of MLSs/MLTs in the 0 – 5 Years group with those in the 5 – 10 Years group. As shown in Chart 3, 57.1% of MLSs/MLTs in the 0 – 5 Years group responded that they are still working for 1 employer. Comparatively, the 5 – 10 Years group reported that 31.3% of respondents have worked for 1 employer. When observing the results, the difference is apparent and meaningful. When statistically comparing the two results they were found to be statistically signficant. One question that can be asked is, “Why do the majority (68.7%) of MLSs/MLTs go to work for another employer within 5 years of starting their careers?”
Summary
This survey is not an indictment of either the MLS/MLT that chooses to stay at 1 employer for their entire career or have 10 or more employers over their career. There is no wrong or right answer and there are benefits for individuals in each scenario. There was no grand design for this survey, just obtain knowledge of MLS/MLT movements in the laboratory community. Hopefully, there will be a larger, more in-depth survey about how mobile MLSs/MLTs are during their career. The data can be beneficial to MLSs/MLTs, managers, and possibly human resource professionals. Understanding why MLSs/MLTs change employers can be helpful also, especially with the coming predicted shortage.
References
1. Bureau of Labor Statistics. Occupational Outlook Handbook. https://www.bls.gov/ooh/Healthcare/Medical-and-clinical-laboratory-technologists-and-technicians.htm#tab-1, Accessed August 18, 2016.
2. Garcia, Edna & Fisher, Patrick B. (2017). The American Society for Clinical Pathology’s 2015 Wage Survey of Medical Laboratories in the United States. American Journal of Clinical Pathology. 147 (4), pp. 334–356.
https://academic.oup.com/ajcp/article/147/4/334/3053484
3. Caldwell, B. (2018). ASCP Laboratory Workforce Report. https://ftp.cdc.gov/pub/CLIAC_meeting_presentations/pdf/Addenda/cliac0418/10_Caldwell_Workforce.pdf
Feature photo by Shutterstock.com.
