

Written by Calvin Ball
“Wherever the fish are, that’s where we go.”
Richard Wagner
Fishing is an enjoyable pastime. Successful fishermen know that being prepared and patient is key to achieving their goal of getting that prized picture and/or catching dinner. If you are successful with the latter, the day’s catch is carefully prepared to ensure the quality of the meat and to avoid as many bones as possible. However, the probability of encountering a bone is high and when encountered, the search begins to identify and remove all bones.
That tenacity and patience to find all of the fish bones is emblematic of the fishbone diagram (also called Cause-and-Effect diagram, Ishikawa diagram). The fishbone diagram process starts with the identification of a few prominent bones (major categories), which are then used to find deeper ones. It is a brainstorming tool used to flesh out the root causes (bones) of a problem, organize them into manageable categories, and serve as a visual method to aid laboratorians in their root cause analysis (RCA).
In order to effectively use the fishbone diagram, the laboratorian(s) must be familiar with procedures/processes, supply-chain, instrumentation, customers/providers (doctors/nurses), staff, and laboratory layout and how each relates to the problem. Identifying where these categories fall within the SIPOC (supplier, input, process, output, customer) process flow that contains the problem is essential to successfully navigating the many branches of the fishbone diagram process. Once complete, the fishbone diagram is a great way to visualize all the possible root causes and how they are possibly interconnected with each other to contribute to the problem.
The fishbone diagram is an outline of a fish skeleton as observed in Figure 1. The problem is placed at the head of the fish and each general category is placed on a major bone. During the brainstorming process, the 5 Whys technique can be used to drill down on each category (Figure 2). When a potential root cause is identified, it is entered as a branch under that category. With each branch, the laboratorian should ask “Why?” The lowest branch or sub-branch is a possible root cause.

Figure 1. Fishbone Diagram Example.
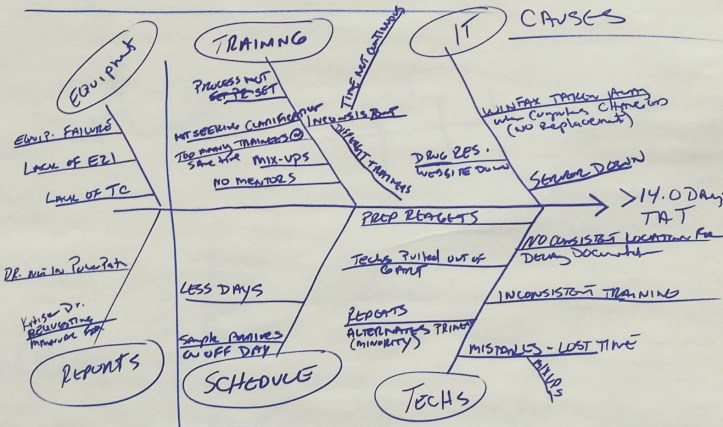
Figure 2. Fishbone diagram detailing possible root causes for prolonged TATs.
Figure 2 shows a fishbone diagram created during a brainstorming session involving an entire department looking into why more than 58% of samples submitted for molecular testing had turn-around-times (TAT) greater than 14 days. Because of the use of a fishbone diagram, a few of the potential root causes were analyzed further using a pareto chart. Ultimately, it was identified that the potential root causes impacting the TAT the most were tests scheduling, the number of trained laboratorians and the training process, and the lack of available testing resources due to other tests being performed.
The fishbone diagram is the meat of the RCA; it establishes a foundation for improvement by identifying all possible root causes, which significantly increases the chances of leading to a solution. As an added bonus of using a fishbone diagram, laboratorians can identify gaps in processes that might not contribute directly to the problem at hand, but may be used for improvement projects down the road or to strengthen the training process.
